


Please Leave Us A Message
Privacy statement: Your privacy is very important to Us. Our company promises not to disclose your personal information to any external company with out your explicit permission.

 July 19, 2022
Summary
Recent studies of low-frequency sound source localization have shown that the lowest positionable frequency is related to room size, sound source/listener position, and spatial reverberation characteristics. Therefore, the larger space contributes to the precise positioning of the low-frequency sound source. Theoretically, the broadband multi-channel live playback system should provide a better sense of hearing than the popular mono sub-low frequency system. This article will explore whether a mono sub-low frequency system will become a major limitation of hearing improvement and whether a stereo sub-low frequency system can provide excellent sound. The survey compares mono and stereo sub-low frequency systems with binaural measurements and a series of listening tests. The stereo sub-low frequency system uses a common left/right stereo configuration.
1 Introduction
In the past few decades, stereo configurations have become the de facto standard in live sound reinforcement systems and, in most cases, by adjusting the sound image of the mixer (based on Rayleigh's Duplex theory) The level difference between the ears). If the advantages/disadvantages of this technique are discussed in depth, it may take a lot of time due to the subjective nature of acoustic perception and it is impossible to draw definitive conclusions. Therefore, this article only discusses one branch of this topic: the benefits of a stereo low-frequency sound reinforcement system.
The topic of applying stereo sub-low frequency systems in live sound reinforcements has become very interesting because of the observations of the authors over the past decade: more and more audio engineers have chosen (in many cases, insisted) A mono auxiliary output bus provides signals to the sub-low frequency system. The source of the subwoofer's signal is not associated with the stereo main output bus. This is due to the fact that audio engineers believe that it is a good way to control which instruments' signals are sent to the sub-low frequency system. But the use of a mono sub-low frequency system poses another problem. Will there be something lost due to the use of this system architecture?
This paper studies this problem through subjective evaluation methods such as binaural recording and actual audition. In the second chapter, we describe the current view of the positioning of low frequency sound sources in an enclosed space, with a focus on room layout and sound source/listener position. In Sections 3 and 4, we describe some experimental measurements and results, and focus on data analysis and potential possibilities (Chapter 5).
2. Low frequency sound source localization
The study of sound source localization can be traced back to a study conducted by Rayleigh in the 1800s a century ago. Subsequently, research based on the Raytheon law describes how humans position the sound source (especially in the horizontal plane). The study of the head-related transfer function (HRTF) extends the study of this problem into a 3-dimensional space. Due to the asymmetry of the human ears, the path of the sound waves reaching the human ear on both sides of the head will be slightly different.
In the professional field, the controversial topic of sound source localization research is: to what extent humans have the ability to locate low-frequency sound sources, and more importantly, whether low-frequency sound sources with directivity in sound reinforcement are important. The author's previous papers provide a literature review of the topic and clarify the views of all parties.
To date, there have been 14 articles focusing on this particular topic (or at least very close to related topics). Six of the papers concluded that low-frequency sources with directivity are very important and/or predictable, while the other six concluded that low-frequency sources with directivity are not important and/or unpredictable. There are also two articles that give conclusions that are mixed and point to the work that needs to be done to solve this problem.
One thing that these papers have in common is that the audition is only performed in one room, and the listening position of the auditor is in the center of the room. Our research examines the results of previous research and goes one step further, simulating sound source localization based on room layout, sound source and listener position, forming a preliminary hypothesis. This study demonstrates that to achieve a localization of the sound source, the distance between the listener and the sound source is approximately 1.4 times the wavelength of the frequency.
This result indicates that the larger the test space, the lower the lower limit of the frequency at which the position can be located. In the field of sound reinforcement applications, the space of the venue is usually relatively large, so we can reasonably assume that the low frequency sound source can be positioned. But a key question is whether the low-frequency signals with directivity are meaningful among the wide-band audio signals. This is the issue we will focus on in this article.
3. Experimental methods
We used two types of sites in the experiment: a large indoor sound reinforcement system test room (room size 11.6 x 10.6 x 9.1 m), the average reverberation time of the test room was 0.5s; an outdoor venue (The only difference is that there is a large building behind the "stage" with a small parking lot about 10m from the speaker). A fully identical sound reinforcement system was used at both sites.
The sound reinforcement system consists of two double 18-inch woofer and two full-range speakers placed on the woofer. The distance between the two sets of speakers is 6.4m, which is symmetrically placed with the center line of the stage as the central axis. In the indoor test, the two sets of speakers were separated by 2.1 m from the nearest side wall and 4.75 m from the back wall.
We set up 9 measurement points in a 3 x 3 layout. In the indoor measurement space, the first row of measurement points is located at half the length of the room, and the other two rows are placed at 2/3 and 5/6 of the length of the room. The spacing between each row is 1.94m. The center axis of each row is located at the midpoint of the room width, and the distance between the other two points and the center axis is 1/4 of the room width (pitch 2.65m). In outdoor measurements, the spacing of the measurement points is consistent, with the midpoint of the speaker group spacing as a reference.
3.1. Objective measurement
The objective measurement is performed by a dummy head with an artificial auricle and a pickup. The signal picked up by the pickup is sent to a laptop running the custom Matlab software for recording and saving audio signals (24 bit / 48 kHz) (via the Sound Devices USBPre audio interface).
The dummy head is mounted on an upright microphone stand (the height of the microphone is 1.2 m) and is placed in turn at each measurement point. Each measurement is played in 3 segments of music at intervals of 5 seconds. The low frequency part of the music clip we are using is not mono, the tracks are as follows:
1.Utne Wire Man – Blue Man Group
2.Comfortably Numb – The Bad Plus
3. Echoes – Pink Floyd
The audio signal is recorded twice: the first is to send the left and right channel signals as monaural signals to the subwoofer (the left and right channel signals sent to the subwoofer are both -6 dB) The second time is to send the left and right channel signals to the left/right side subwoofers respectively (both left and right channel signals are 0 dB). During the two recordings, the signal sent to the tweeter is processed by a crossover with a division point of 100 Hz.
All measurements are saved as stereo wav files using proprietary names for subsequent analysis.
3.2. Subjective evaluation
The subjective evaluation test is performed in an indoor environment, and the listening area is the position of the measurement point in the middle row. The test material also uses the above three music pieces. Participants sit at each measurement point, and the music material plays A/B random switching mode. Participants need to evaluate the two pieces of music material that are heard at each listening position, and there is no limit to the length of listening.
The A/B comparison uses a random selection of the music material and each piece of music material in a mono or stereo configuration. The duration of each full-process test averages 10 minutes.
Subjective evaluation data and objective measurement data of each participant were used for the result analysis.
4. Data analysis
We use binaural recording to try to correlate objective measurements with the sense of hearing played back by the sound reinforcement system. In this case, we focus on the accuracy of the playback of the sound reinforcement system to ascertain whether the stereo sub-low frequency sound reinforcement system is beneficial.
The first step in data analysis is to remove the mute portion of the recording (as previously mentioned, the three pieces of music material are recorded in the same file at 5 second intervals). We used a series of threshold processors to mark the start of each measurement segment, the recorded file was split into 3 separate segments, and the segments were resampled to ensure their sample rates were the same. Due to the memory limitations of the PC processing data, the maximum available sample rate is 32 kHz, which means that the maximum frequency limit for data analysis is 16 kHz. Since our research goal is the low frequency part, this frequency upper limit will not affect.
The length of the recorded file can be analyzed after it has been trimmed. Each measurement signal is compared with its corresponding source by calculating the cross-correlation between the two signal peaks. This comparison process independently performs the left and right channel signals in the stereo signal, and takes the average of the two signals as a metric.
Once all cross-correlated signal peaks have been determined, it means that the three music segments of each measurement point have been calculated and the calculation results are also plotted as a graph. Because of the differences in peak cross-correlation between mono and stereo sub-low frequency systems, outdoor test results are graphically represented (Fig. 4.1). For stereo sub-low frequency systems, a positive value indicates a higher correlation; for a mono sub-low frequency system, a negative value indicates a higher correlation.
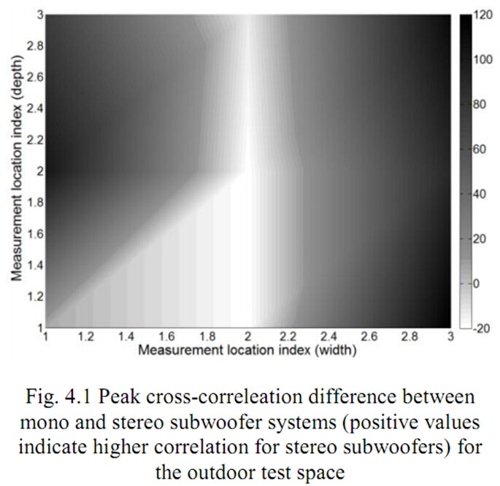
The bottom of the figure is the front section of the stage, and the position of the measuring points in the horizontal and vertical axes is expressed as an integer exponential.
The results shown in Fig. 4.1 show an interesting phenomenon that we did not expect at the beginning of the study. We expect that the listener at the central position (width measurement position index of 2) will get the best listening experience in the stereo sub-low frequency system configuration, and will gradually deteriorate as the listening position deviates from the axial direction. However, the results shown in the figure are just the opposite.
The listener's listening point at the central location does not yield any benefit from the stereo sub-low frequency system, which shows a large number of higher frequency components picked up at the central listening point. However, the measurement points deviating from the central axis are completely different, and the measurement results show that the off-axis area is optimal in the configuration of the stereo sub-low frequency system. The resulting problem is why the stereo sub-low frequency system will make the off-axis area better than the mid-axis area.
The theory presented in this paper may be unremarkable, but it is the basis for this result. The reason why the off-axis area can obtain better results is that the stereo sub-low frequency system has the characteristic that the stereo signals have no correlation with each other, and this characteristic is independent of the operating bandwidth of the sub-low frequency system. This uncorrelated property suppresses the appearance of troughs in the listening area, which is often the main obstacle to providing uniform low frequency coverage over a wide listening area.
To further explore this theory, the transfer function of each measurement point is calculated by performing a Fast Fourier Transform (FFT) algorithm on both the input and output signals. The calculation result of the output signal is multiplied by the conjugate complex number of the input signal (similar to the analysis of the MLS measurement result) and scaled according to the FFT length, and then the vector data is obtained by Fourier transform inversion and the speed of each measurement point is obtained. Transfer Function. The frequency response from 40 – 100 Hz (the operating bandwidth of the sub-frequency system under test) is represented by a graph. We measured the data of the measurement points (length index 2) across the middle row of the mono and stereo systems. The result is shown in Fig. 4.2.

It is clear that the stereo sub-low frequency system has a smaller variation in the frequency response amplitude in the listening area. This result can be calculated by the following equation: The spatial variation of these three measurement points under mono system and stereo system conditions:
Where: SV = spatial variation (dB)
Nf = number of frequencies Np = number of measurement points flowfhi = frequency range (Hz)
Lp(p, I)= Sound pressure level at the measuring point p when the frequency is i (dB)
Lp(i) = sound pressure level (dB) at all measurement points at frequency i
In outdoor measurements, the spatial variation of the mono sub-low frequency system is 6.5 dB, the variation of the stereo system is 4.9 dB, and the variation is reduced by 24%. The asymmetry of the left and right channel frequency responses is due to the music material used for testing (non-standard test signals) and the edge of the building behind the speaker group (almost flush with the right speaker group).

The analysis process of the indoor measurement data is the same as the data analysis process of the outdoor measurement. As shown in Fig. 4.3 and 4.4, peaks due to coherence appear in the listening area.
In the indoor measurement environment, the spatial variation of the mono and stereo sub-low frequency systems is 4.2 dB and 3.5 dB, respectively, and the variation is reduced by 16%. The reason for the smaller improvement than the outdoor measurement is due to the influence of the room; the asymmetry of the frequency response is due to large objects (stage, steps, etc.), and the entrance corridor is located at the left rear of the room.
As described in section 3.2., we conducted subjective listening tests only indoors. Subjective listening tests are just an informal test because of the small number of participants. For this reason, it is not possible to perform a statistical analysis of the results of the subjective listening test, but it still shows a clear tendency in this test. Participants found it difficult to distinguish between mono and stereo sub-low frequency systems, probably due to the large number of higher frequency energy components in the listening area.
Although the difference in sound perception between the two types of sub-low frequency systems is very small, the participants experienced an overall increase in low frequency energy in the off-axis area. This result is almost identical to the measurement result, because the interval between the subwoofers in the mono system causes interference between the related signals and causes a large number of troughs in the listening area; when using the stereo sub-low frequency system, The left/right channel stereo signal has no associated natural properties, thereby suppressing the appearance of troughs in the listening area.
5. Discussion
We propose to study this issue to see if stereo stereo systems can provide a better listening experience (in terms of providing stereo images) in a wide-range live sound application in a listening area. Even though the listening test is an informal and simple test, combining the test results with the binaural measurement data, the stereo sub-low frequency system does not provide a better listening experience in this respect.
In people's expectations, the midpoint position of the listening area (the position equidistant from the left/right speaker group) is best when using the stereo full-range sound reinforcement system, so these locations are called "desserts". However, when using the stereo sub-low frequency system, there is no better listening effect in these positions, either subjectively or objectively, but in the off-axis area, it shows higher for stereo system and mono system conversion. Sensitivity. This result has moved our work from the beginning to the path beyond expectations.
In the current live sound reinforcement applications, the mono sub-low frequency system is the mainstream configuration. Due to the presence of zero pressure points in the listening area, this system configuration can compromise the listener's auditory experience due to low frequency attenuation at these zero pressure points. Does not use a single subwoofer placed at a uniform interval on the front end of the stage (which can reduce the appearance of troughs), and whether the stereo subwoofer group configured with the left/right channel can be significantly improved, the current industry There is no final conclusion on this.
Our study found that the significant improvement in stereo sub-low frequency systems in this respect is due to the inherently uncorrelated characteristics of stereo signals, which reduces unwanted signal coherence and significantly reduces the probability of troughs. The music piece used in the test is because the low-frequency instruments (drums and basses, etc.) in the mix are in the off-axis area in the mix, so there is no correlation characteristic among the left/right channel signals, but in the large The sound image localization of drums and bass in most live events is usually in the middle of the mix.
This raises the question of whether the signal processing technique can be used to achieve the non-correlated characteristics of the low frequency signal and thereby partially solve the problem of the zero pressure point. Some early studies have shown that the use of discrete signal processing techniques can, to a certain extent, impart uncorrelated characteristics to mono audio signals radiated by multiple point sources. The core of this technology is the distributed speaker layout. This technique reveals that when spatially separated sound sources are superimposed, the areas that form beneficial interference and harmful interference are discretely distributed. These discretely distributed interference regions instead form a polarity distribution with better uniformity and wider coverage. In the next step, we propose an in-depth study of this signal processing technique with a focus on low-frequency sound reinforcement applications (multiple subwoofers to cover larger areas).
Interestingly, there was actually a similar example a few years ago. The mono sub-low frequency signal routing of the sound reinforcement system is configured as two independent processing channels, and the filters applied to each channel signal are slightly different, thus making the signals of the two channels have no correlation characteristics. This unrelated feature avoids the large number of peaks and troughs in the listening area. The remaining question is whether there will be a more complex signal processing technique that introduces random phase techniques to further improve the uniformity of low frequency coverage (reducing the appearance of peaks and troughs).
6 Conclusion
The original intent of this study was to make a perceptible difference in comparison to a mono sub-low frequency system when the stereo sub-low frequency system was used in a full-frequency system. The results of binaural measurements and informal listening tests show that stereo sub-low frequency systems do not produce appreciable differences in live sound reinforcement applications.
One thing to note is that the test signal is a stereo output rather than a delay through the pan control of the mixing system. Stereo output by adding delays may be a better choice for low frequency positioning, which is a key point in Rayleigh's Duplex theory. Further research is needed in this regard, and through these findings, it is finally determined whether the stereo sub-low frequency system is effective as a means of improving subjective hearing in live sound reinforcement applications.
Although there is no definitive evidence that stereo sub-low frequency systems can improve subjective sound perception in live sound applications, our research has found that stereo sub-low frequency systems can indeed help on a critical issue. Due to the inherently uncorrelated nature of the left/right channel signals, harmful interference is greatly reduced in the listening area, reducing the chances of peaks and troughs. Of course, this is not a new idea. However, we should still study the extent to which random phase processing techniques can suppress the occurrence of peaks and troughs without affecting the sound quality.
In general, stereo sub-low frequency systems do not seem to provide us with a better subjective sense of hearing in live sound applications, but they do reduce the amplitude of spatial amplitude variations in the listening area, allowing us to Get a more balanced listening experience in large-scale live events.
Author:. Adam J. Hill & MalcolmO.J Hawksford
Translation: Kim Grandpa
Source: Yike International
The above is the The advantage of using stereo sub-low frequency system in the sound reinforcement system in the sound system we have listed for you. You can submit the following form to obtain more industry information we provide for you.
You can visit our website or contact us, and we will provide the latest consultation and solutions
Send Inquiry
Most Popular
lastest New
Related Products
Send Inquiry
Privacy statement: Your privacy is very important to Us. Our company promises not to disclose your personal information to any external company with out your explicit permission.
Fill in more information so that we can get in touch with you faster
Privacy statement: Your privacy is very important to Us. Our company promises not to disclose your personal information to any external company with out your explicit permission.